January 2026 EV Sales | Best Selling EVs as Vahan Data
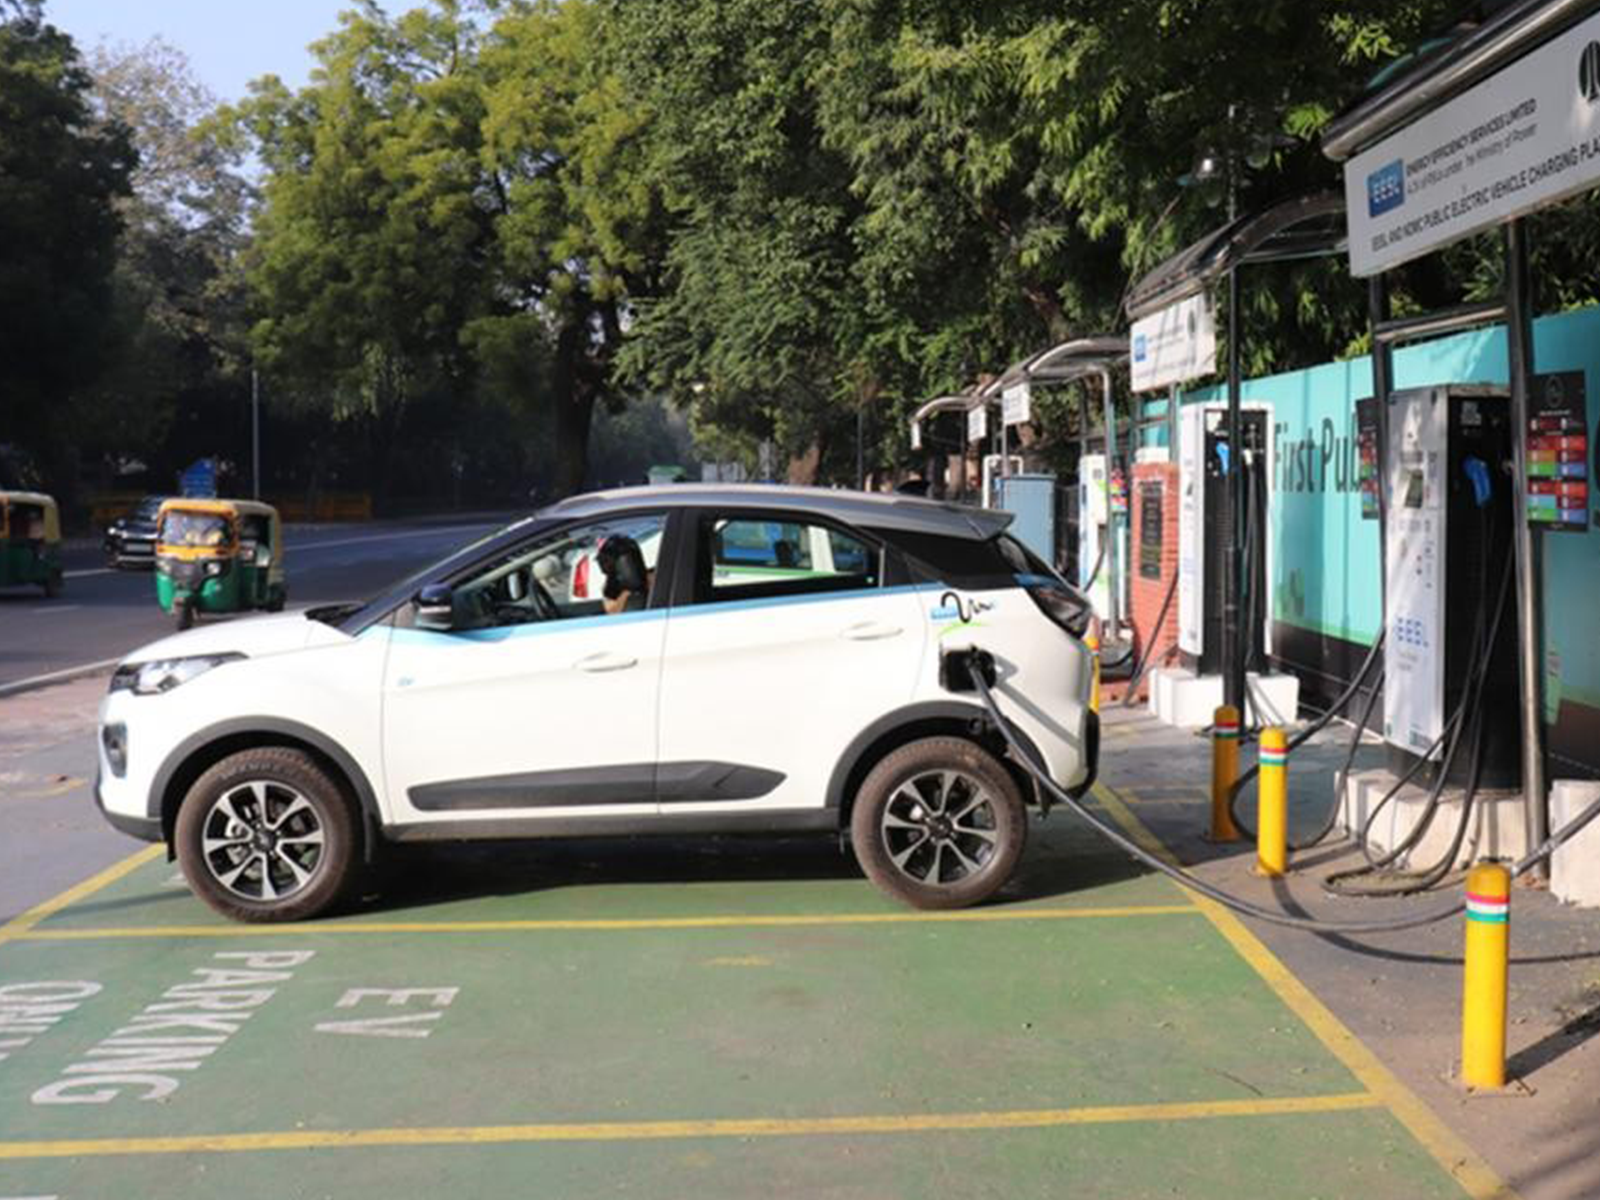
Electric Vehicle Sales in India witnessed a mixed growth trend in January 2026 as compared to December 2025. If we look at the E4W sales, it showed a significant increase in sales to 18,055 from 15,626 units. The E3W L5 Passenger sales recorded a marginal increase to 20,554 from 20,340 units.
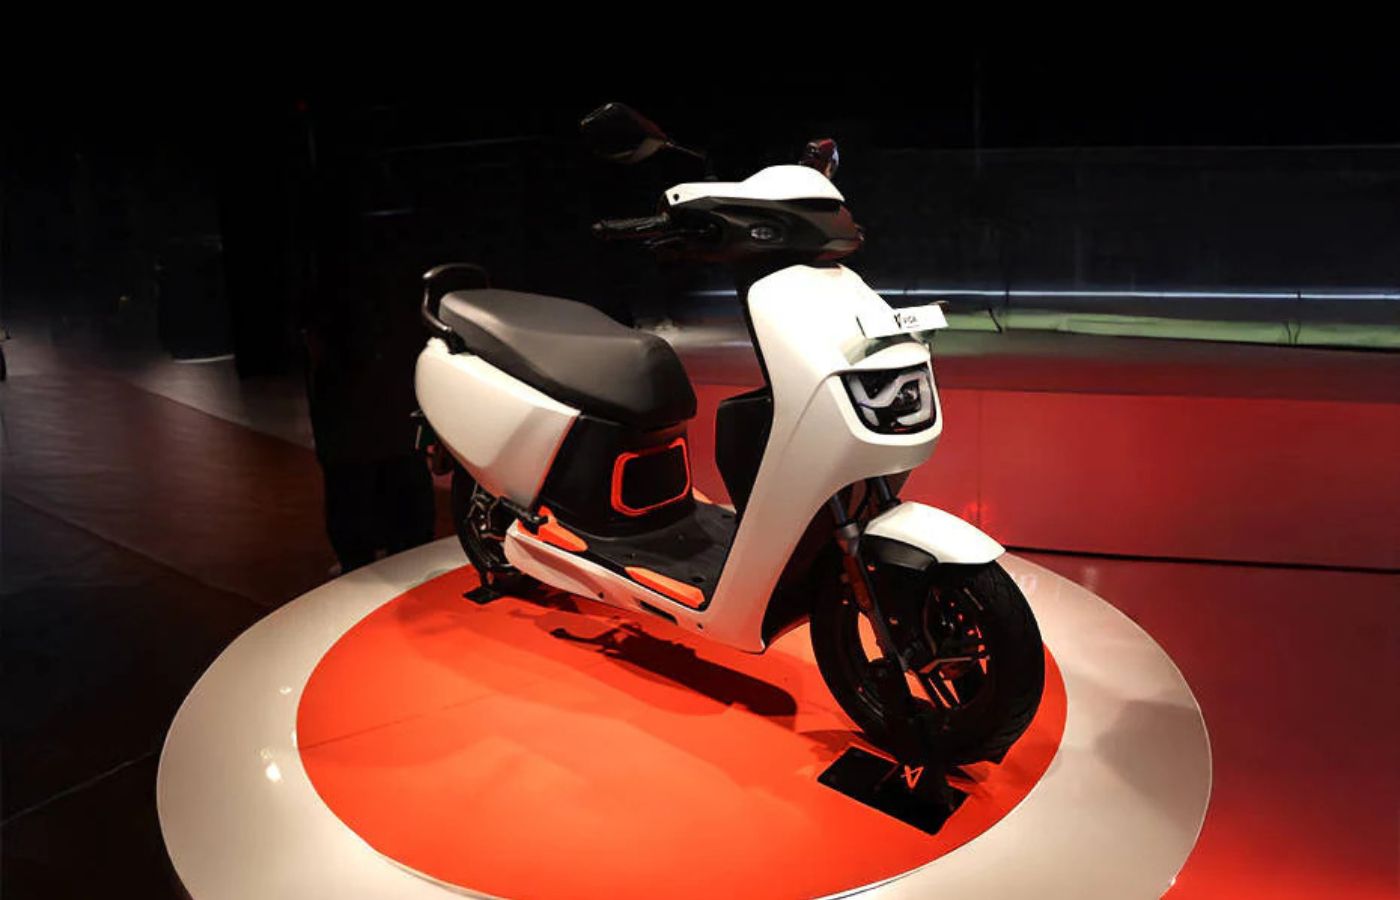
Talking about the electric commercial sector, the Cargo/Goods sales increased to 3,117 from 2,897 units, while the e-carts rose up to 7,654 from 7,608 and E-Goods Carrier sales saw a jump to 1,639 to 1,396. However, the e-rikshaw sales show a major decline to 44,439 units from 57,432, while e-bus sales fell to 391 from 569 units.
AdvertisementCompany wise Electric 4-wheeler Sales January 2026
| S No. | Company | Jan-26 | Dec-25 | Difference | Market Share Jan-26 |
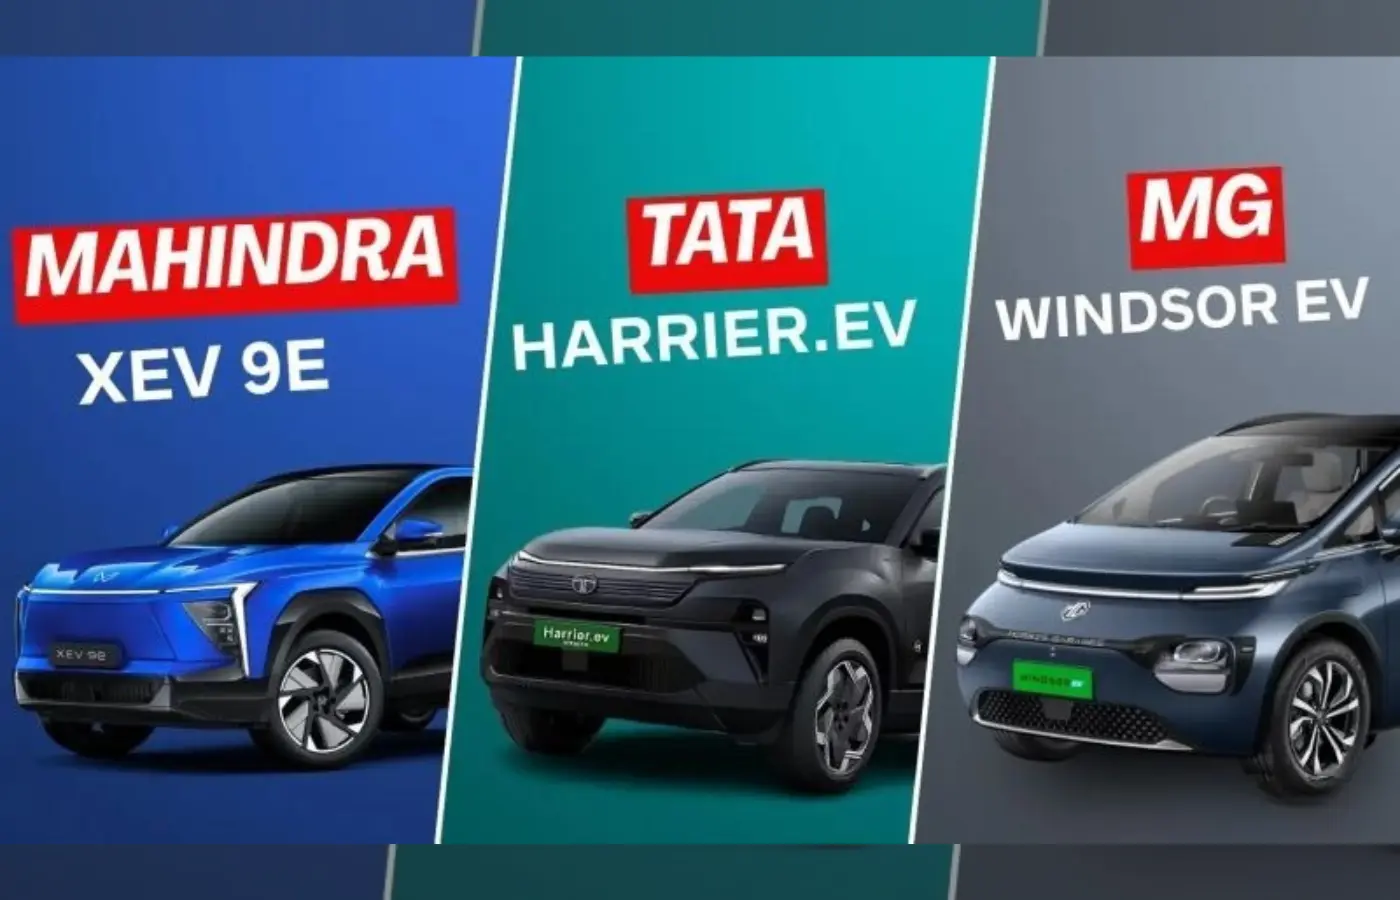
| 1 | Tata Motors | 7,863 | 6,767 | 1,096 | 43.6% |
| 2 | JSW MG Motor | 4,606 | 3,748 | 858 | 25.5% |
| 3 | Mahindra | 3,589 | 3,270 | 319 | 19.9% |
| 4 | Vinfast India | 432 | 383 | 49 | 2.4% |
| 5 | Hyundai | 326 | 272 | 54 | 1.8% |
| 6 | BMW India | 312 | 356 | -44 | 1.7% |
| 7 | Kia India | 306 | 328 | -22 | 1.7% |
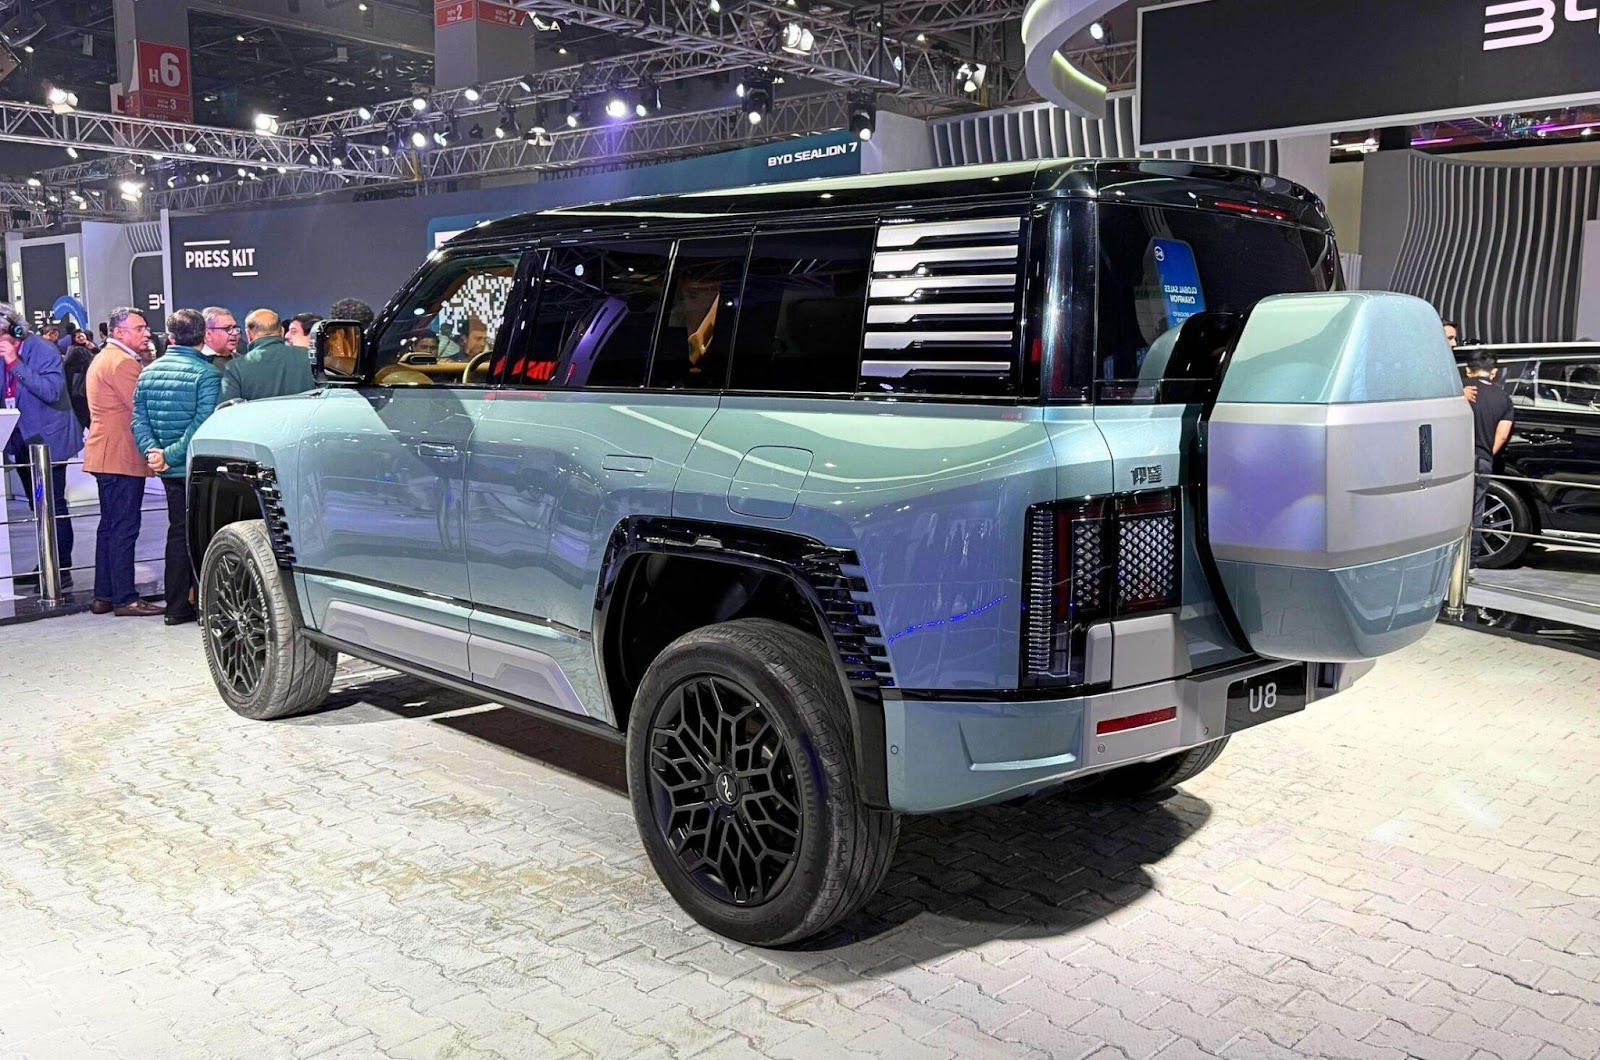
| 8 | BYD India | 224 | 256 | -32 | 1.2% |
| 9 | Maruti Suzuki | 210 | 9 | 201 | 1.2% |
| 10 | Mercedes Benz | 69 | 71 | -2 | 0.4% |
| 11 | Stellantis | 41 | 45 | -4 | 0.2% |
| 12 | Tesla India | 37 | 69 | -32 | 0.2% |
| 13 | Others | 40 | 52 | -12 | 0.2% |
| TOTAL | 18,055 | 15,626 | 2,429 | 100% |
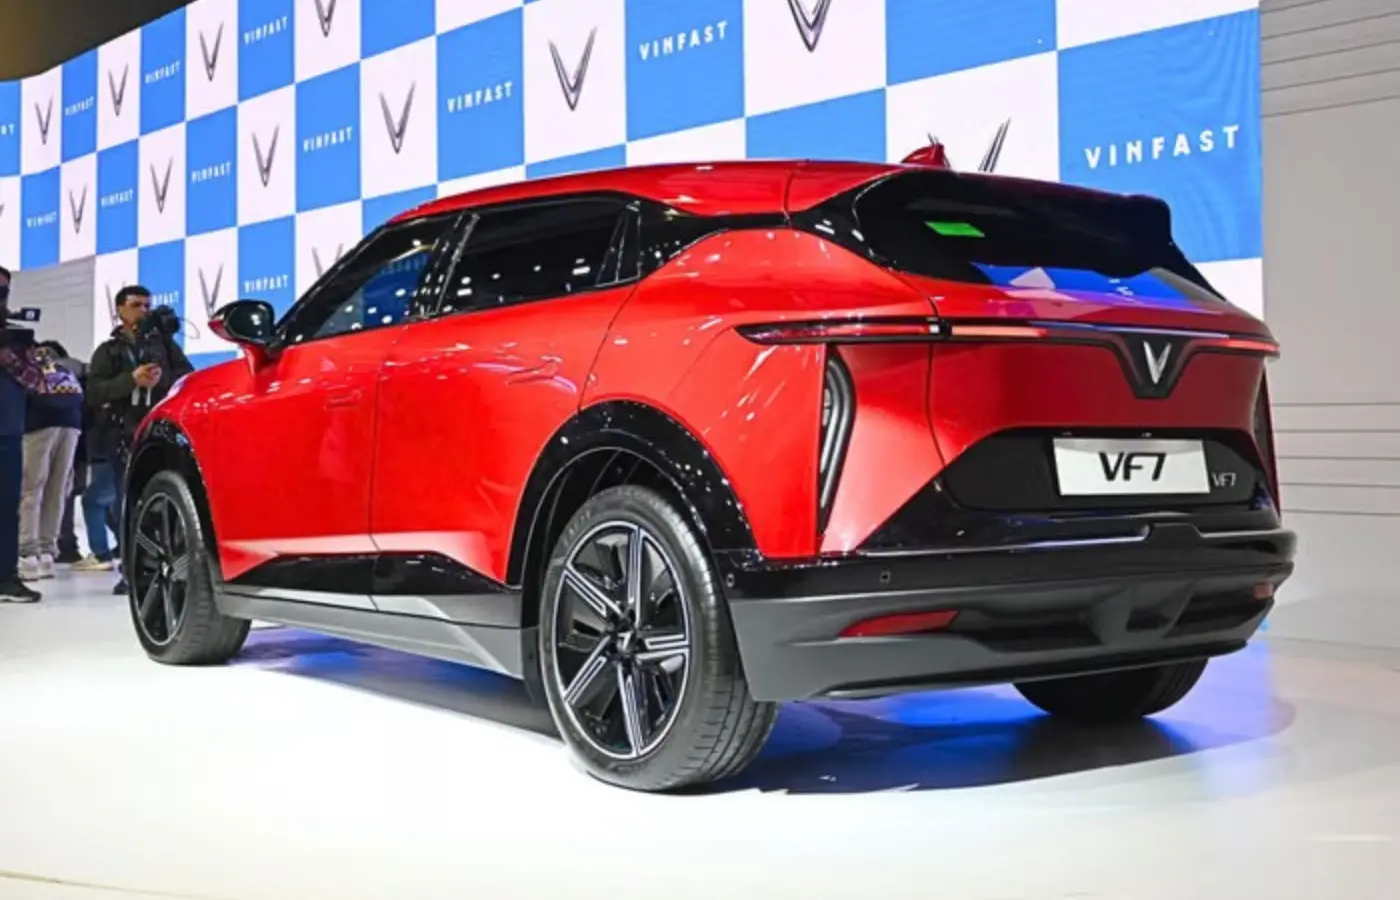
Tata Motors has solidified its position at number one spot with 43.6% of India’s EV market share, followed by JSW India and Mahindra maintaining their positions with 25.5% and 19.9% market share respectively. Vinfast has also maintained its position by jumping to third position in December 2025 with 2.4% of market share.